When looking at buying a house or car, we conduct due diligence. For a house this might involve researching the local schools, and obtaining a builder’s report. And for a car this might involve having a test drive, and getting a mechanical inspection. Due diligence is about gathering the essential and relevant information, in order to help you make a well-informed decision about a potential purchase.
The same concept should also be applied by investors when buying shares. Remember when you buy shares you are not only buying a financial instrument, but you are also buying part ownership of a business – and you should perform due diligence to inform you whether the business is worth investing in.
There’s no set method for conducting due diligence on shares, and I myself am far from being an expert in researching companies. And many people are happy with gambling and speculating on shares without performing any research. But for those wanting to do their own evaluation on companies before investing, this article explains how I’d get started.
This article covers:
1. Initial Research
2. Non-Financial analysis
3. Financial analysis
1. Initial Research
Finding companies to invest in
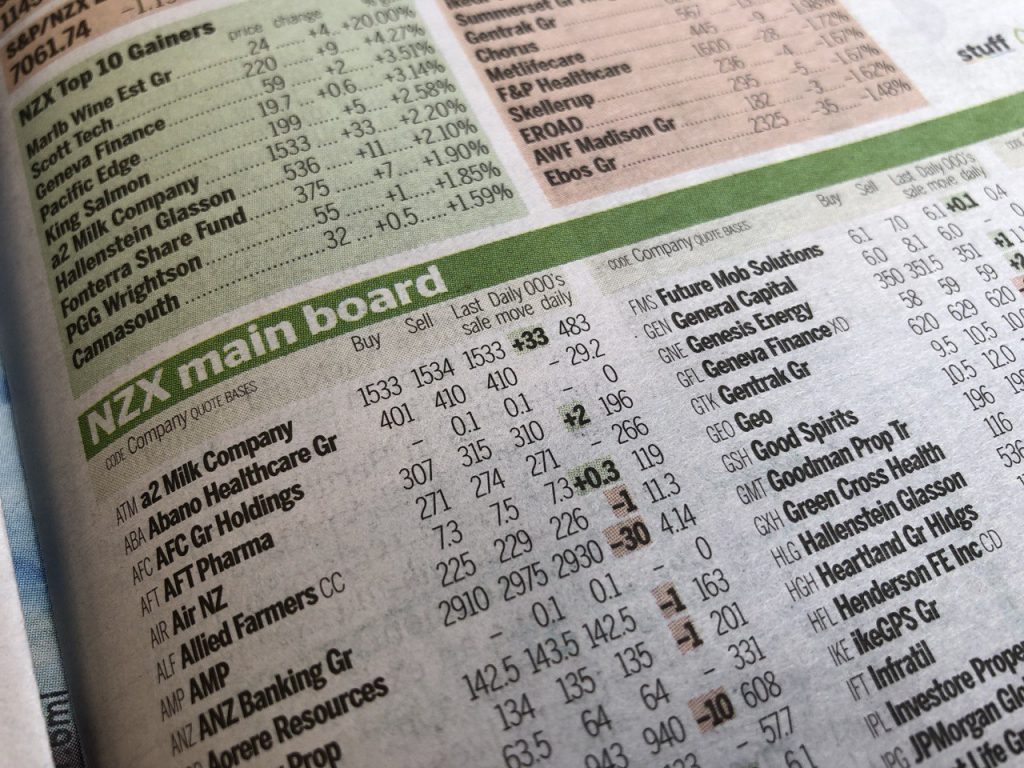
The first step is finding prospective companies to invest in and evaluate. To get you started, here’s a list of companies in the NZX 50, the fifty largest companies trading on the NZ sharemarket:
There are many other sources in which you can discover what companies are out there:
- Discussions in online communities
- Browsing companies on a brokerage site like Sharesies
- Reading about a company on the news
- Hearing about it from a family member or friend
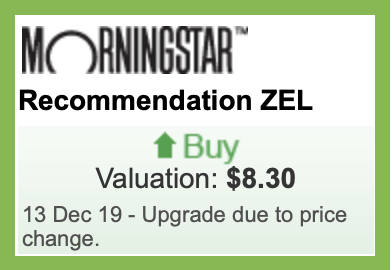
Another source people might use is a broker’s or analyst’s recommendation, such as Morningstar’s recommendations found on the ASB Securities site. A buy recommendation from these sources does not necessarily make it a good purchase! For example, Z Energy’s current share price is $4.40, while Morningstar values the company at $8.30. Such an astronomical valuation seems hard to believe, given the way the industry is trending.
Instead, I would just use all the above sources as a helpful starting point. You will need to do more of your own research before making a sound investment decision.
Learning more about a company
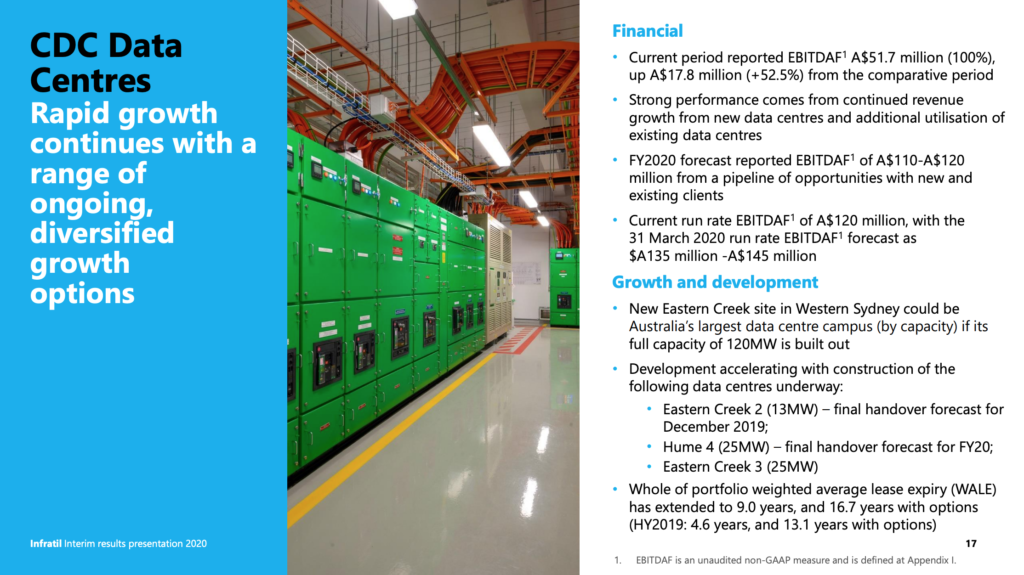
To kick off your evaluation on a company, you want to find out about the basics such as their business model, business units, and how they make money. A company’s annual report is a great place to start, and is typically accompanied by an easy to digest results presentation.
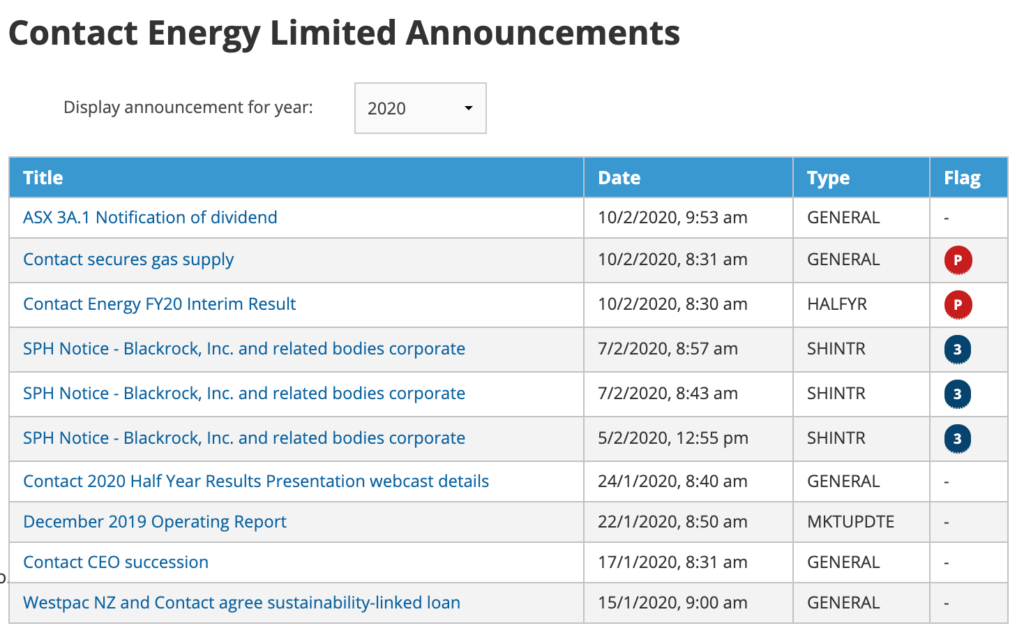
Annual reports and presentations can all be found on the NZX website if you dig through each company’s announcements page. For overseas companies, you would need to look at the site of the relevant exchange the company is listed on.
Other sources you can use to conduct some research are a company’s website (listed companies typically have an Investor’s centre section), and articles about the company on mainstream media.
Checkpoint
Before continuing on to do further research on a company, ask yourself:
- Do you understand the company and how they make money?
- Is it a business you can support? For example, some people may be comfortable investing in a gambling related company like SKYCITY, but many others won’t.
- Does it feel like a company worth looking into further?
If you answered yes to all these questions, you carry on to the step!
2. Non-Financial analysis
The second step of evaluating a company is digging deeper into its non-financial side, and includes:
- Analysis on the company itself
- Analysis on external factors that can impact the company like competitors, the industry, and the wider economy.
Sources you could use to perform this analysis are news articles, annual reports, and general research into the industry the company is operating in. And perhaps most importantly, you will also need your own general knowledge, and thinking to perform this analysis – a good reason to only invest in companies that you can understand.
Analysis frameworks
Here are two simple frameworks you can use to guide or structure your non-financial analysis on a company – you may have heard about these frameworks in school/uni (particularly if you were a commerce student), and now you get to use them in real life! Here’s a brief rundown on them, but you can Google them if you want to know more:
SWOT Analysis
SWOT is a framework which helps you think about a company’s internal strengths and weaknesses, as well as their external opportunities and threats. SWOT stands for Strengths, Weaknesses, Opportunities, Threats:
- Strengths – Consider what are the internal factors that make a company great, or give them a competitive advantage over other companies? E.g. Air New Zealand’s strengths are considered to be strong brand awareness and a good management team.
- Weaknesses – Think about the internal factors that make a company not so great? E.g. A weakness of Sky TV might be its lack of ability to innovate and compete in the online streaming space.
- Opportunities – What are the external factors that could benefit a company? E.g. Increased data consumption and 5G networking could be an opportunity for Spark.
- Threats – What are the external factors that could hurt a company? E.g. A threat to Z Energy could be increased competition from Gull and Waitomo, and increased adoption of electric vehicles.
PESTLE Analysis
PESTLE is a framework which helps you think about the major external factors that might impact a company. It complements SWOT by helping you look at a company’s opportunities and threats in more detail. PESTLE stands for Political, Economical, Social, Technological, Legal, Environmental:
- Political – What political factors (e.g. government policies, international relations) could impact the company? E.g. Government policy to increase the minimum wage could increase costs for companies like Restaurant Brands.
- Economical – What economical factors (e.g. exchange rates, interest rates) could impact the company? E.g. Falling interest rates could benefit high yielding companies like Genesis Energy.
- Social – What social factors (e.g. demographics, cultural trends) could impact the company? E.g. The ageing population, resulting in increased demand for retirement homes and aged care services, could benefit Oceania Healthcare.
- Technology – What technological factors (e.g. innovations in technology) could impact the company? E.g. An increase in online retailing could hurt retail-heavy REITs like Kiwi Property Group.
- Legal – What legal factors (e.g. laws, regulations) could impact the company? E.g. The upcoming medical cannabis regulation changes would benefit Cannasouth.
- Environmental – What environmental factors (e.g. geography, climate, weather) could impact the company? E.g. Desire to decarbonise the economy could help Infratil’s renewable energy ventures.
Checkpoint
So you’ve done some non-financial analysis on a company, and you believe that:
- It is full of strengths, and they outweigh its weaknesses
- The company has a bright and promising future, with no alarming factors that could hurt the company.
Then you can move on to looking at a company’s financials!
3. Financial analysis
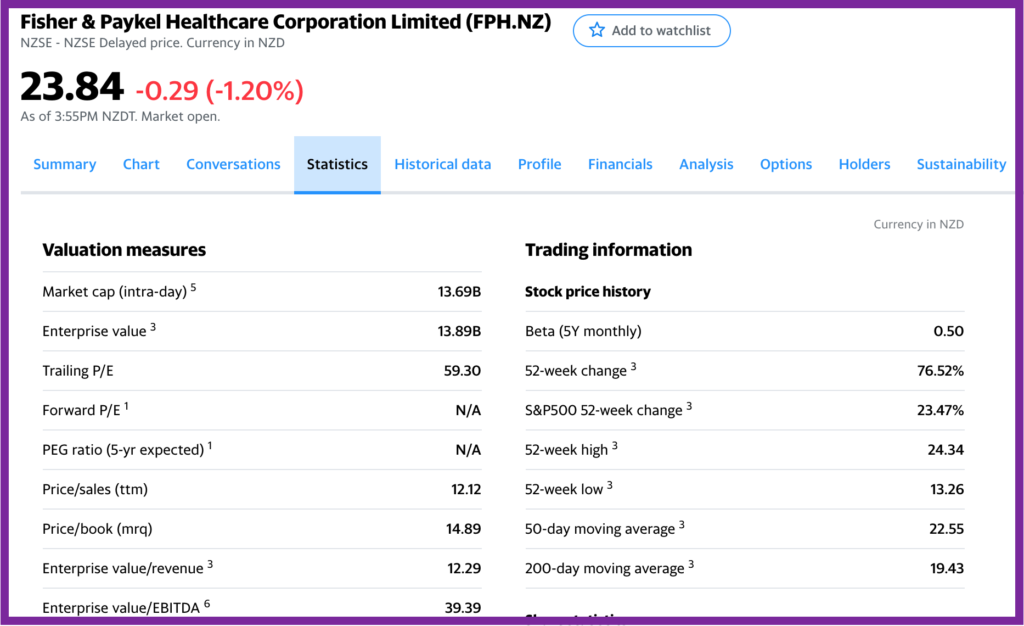
The third step of evaluating a company is looking into their financials. You can find this information in a company’s financial reports, or on sites like Yahoo Finance.
My knowledge of accounting and financial measures is very rusty, but I’ve included a quick rundown on some of the most common financial measures that you can use to evaluate a company’s financials:
Common measures
Share Price
A company’s share price is how much you’ll pay per share (or unit of ownership) of the company. By itself, share price is largely irrelevant to assessing a company’s financials. The fact that Mainfreight’s share price is $40.90, and Auckland Airport’s share price is $8.75 is meaningless – A bigger share price doesn’t necessarily mean a company is more valuable or expensive, nor does a smaller share price make a company cheaper.
Market Cap
Market cap is how much all of a company’s shares are worth at its current share price, and is essentially an indicator of the size of a company. Examples are:
- Mainfreight – With 100.7 million shares on issue, at $40.90 per share, Mainfreght’s market cap is $4.12b
- Auckland Airport – with 1.22 billion shares on issue, at $8.75 per share, Auckland Airport’s market cap is $10.6b
Market Cap = Share Price x Number of outstanding shares
Market cap is not an indicator of a company’s financial strength. However, companies with larger market caps tend to be more established companies, while lower market cap companies may have potential for higher growth but could come with higher risk and lower liquidity.
Earnings Per Share (EPS)
EPS measures much money the company makes per share. For example, Mainfreight’s net income in the last year $141.05 million, giving them an EPS of $1.40 for each of their 100.7 million shares.
EPS = Net income/Number of outstanding shares
It might be useful to look at how a company’s EPS is trending over time, as an indicator as to whether a company is growing, declining, or staying flat in profitability.
PE (Price-Earnings) ratio
The PE ratio essentially shows how much you have to pay for $1 of a company’s earnings, and is a handy indicator of how cheap or expensive a company is. For example, Mainfreight’s PE ratio of 29.21 means at the current share price of $40.90, investors have to pay $29.21 to get $1 of Mainfreight’s earnings.
PE Ratio = Share Price/Earnings Per Share
A lower PE ratio means a company is cheaper, but that doesn’t mean it’s better – for example, companies with higher growth prospects tend to come with higher PE ratios. Instead the PE ratio is a handy metric to compare a company against others in the same industry, and to compare against its historical PE ratio as an indicator to whether the company is currently under or over-valued.
NTA per Share
NTA (Net Tangible Assets) per share essentially shows how much money you’d have left per share if you liquidated, or sold off all a company’s physical assets and paid off all its liabilities. For example, Oceania Healthcare has a NTA per share of $1.01, which means their physical assets minus liabilities equates to $1.01 for each outstanding share. It is sometimes known as Book value per share.
NTA per share = Net Tangible Assets/Number of outstanding shares
A NTA per share close to or above a company’s share price could indicate that a company is cheaper or potentially undervalued (although not necessarily better). It is another handy metric to compare a company against others in the same industry, for example, IT companies might have an NTA per share well below their share price as they can hold high levels of intangible assets.
Debt to Equity ratio
Debt to Equity indicates how much debt a company holds in relation to their net assets, in other words, how much debt a company is using to fund their assets and operations. For example, Precinct Property’s Debt to Equity ratio of 0.42 means it has $0.42 of debt for every $1 of equity.
Debt to Equity ratio = Total liabilities/Equity
Higher is riskier, given this could leave a company more susceptible to interest rate rises or economic downturns. However, debt isn’t all bad as it can be used to leverage or fund a company’s growth. In any case, it’s best to compare a company’s debt to equity ratio to others in the same industry.
Return on Equity (ROE)
ROE is an indicator of the level of returns a company has generated from their equity, in other words, how well a company uses their net assets to generate profits. For example, Heartland Group generated a 9.8% return on their equity in the past year.
ROE = Net income/Equity
Generally higher ROEs are better. But as always, it’s best to compare a company’s ROE against others in the same industry.
Dividend yield
A company’s dividend yield is an estimate of the amount of dividends you might earn from owning shares in that company – For example, Spark’s current dividend yield of 4.66%, means you might earn a dividend of $4.66 for every $100 you invest in Spark.
Dividend yield = Annual dividends per share/Share price
Higher dividend yields do not make a company better. Lower or 0% yields could mean that the company is simply reinvesting their profits into further growth. Dividend yields are also backwards looking, calculated on past dividend payments, and there is no guarantee that future dividends will be at the same levels.
Dividend Payout ratio
The payout ratio refers to the percentage of a company’s profits it pays out as dividends. For example, Summerset’s payout ratio of 13.21% means 13.21% of its previous year’s profit was paid out to shareholders as dividends, while the remaining 86.79% was used for other purposes like expanding the business or paying off debt.
Payout ratio = Dividends paid/Net income
A lower payout ratio could mean the dividends are more sustainable, that the company has room to increase their dividend in future years, or that the company has a preference to reinvesting profits into growing the business. Again you should compare this metric against other companies in the same industry, for example, REITs tend to have higher payout ratios.
Further Reading:
– Dealing with Dividends – 5 things to know about them
Example Comparison
An example of comparing financial metrics between aged care companies Ryman (RYM), Summerset (SUM), Arvida (ARV), and Oceania (OCA).
| RYM | SUM | ARV | OCA | |
| Share Price | $16.40 | $8.97 | $1.88 | $1.21 |
| Market Cap | $8.18b | $2.06b | $1.02b | $737m |
| EPS | $0.69 | $0.94 | $0.17 | $0.10 |
| PE ratio | 23.8 | 9.59 | 11.33 | 12.47 |
| NTA/Share | $4.59 | $4.73 | $1.56 | $1.01 |
| Debt/Equity | 0.67 | 0.5 | 0.39 | 0.49 |
| ROE | 15.86% | 22.25% | 11.66% | 10.17% |
| Div Yield | 1.44% | 1.42% | 3.09% | 4.08% |
| Payout ratio | 32.9% | 13.21% | 33.21% | 48.45% |
Checkpoint
If you’ve looked into a company’s financial metrics and found that they are favourable or in line with other companies in the same industry, then it might be a company worth investing in! Time to deposit funds into your brokerage account and place an order!
Further Reading:
– Buying shares on the NZX – Sharesies vs ASB Securities and Direct Broking
Conclusion
This article has just covered the basics of what to look out for when evaluating a company to invest in. There are endless techniques, metrics, and strategies that can be used to evaluate a company, and I have just scratched the surface – but hopefully this article has given you enough information to get started in performing due diligence on companies, in order to help you make better informed investment decisions.
And if you don’t think all this analysis is right for you, remember there is always a friendlier way to invest in shares – You could instead invest in Funds that contain shares, and that way you can leave the evaluation and picking of companies up to the fund managers.
Follow Money King NZ
Join over 7,500 subscribers for more investing content:
Disclaimer
The content of this article is based on Money King NZ’s opinion and should not be considered financial advice. The information should never be used without first assessing your own personal and financial situation, and conducting your own research. You may wish to consult with an authorised financial adviser before making any investment decisions.